The Engineering Leadership Dashboard Is About to Change Forever

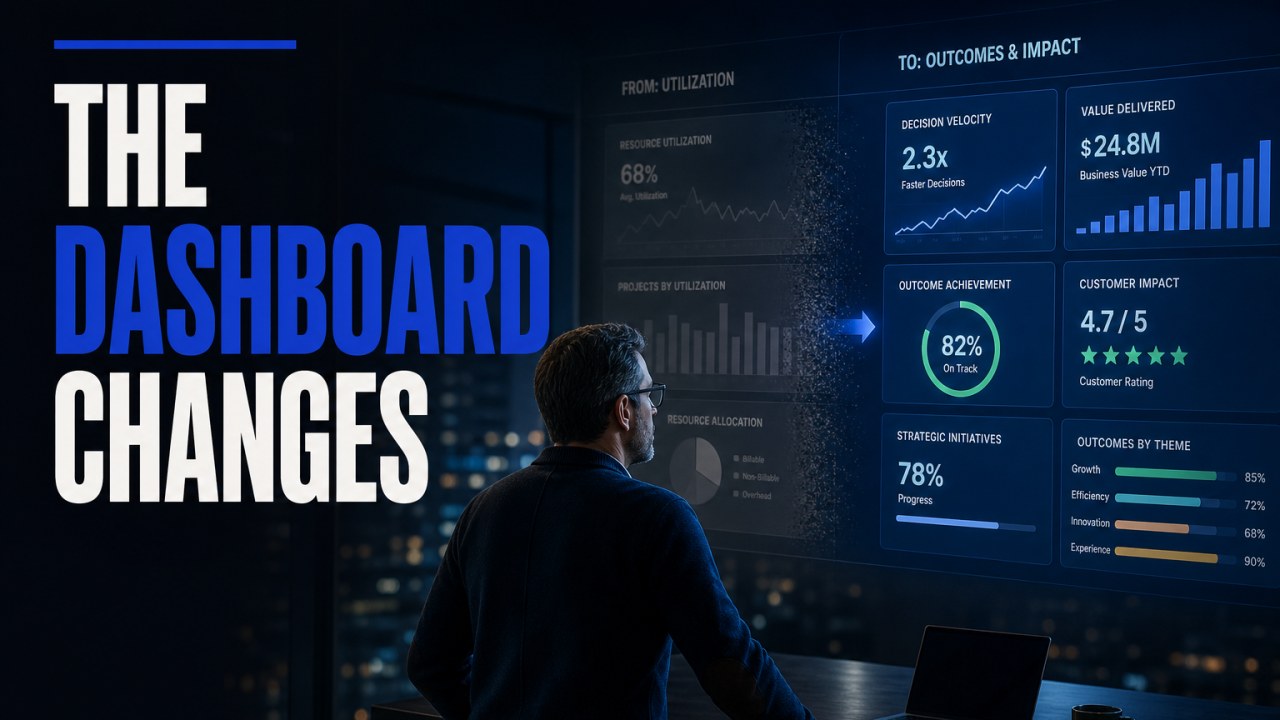
Every CTO has a dashboard. CPU utilization. API latency. Error rates. Deployment frequency. These have been the canonical metrics for a generation. They're about to become table stakes.
The new dashboard won't measure infrastructure health. It will measure organizational intelligence health.
What We Currently Track
The current dashboard answers operational questions. Is the system up? Is it fast? Are we shipping? Important questions. They tell you whether the machine is running. They don't tell you whether the organization is getting smarter, whether knowledge is spreading, or whether your architecture is becoming more resilient or more brittle over time.
What the New Dashboard Tracks
Architectural drift velocity — how fast is your system deviating from its intended architecture? Engineering friction — how much time do engineers spend on undifferentiated work versus high-leverage work? Decision latency — how long does it take to make a technical decision that sticks? Knowledge concentration — what percentage of critical system knowledge is held by fewer than two people?
These are harder to measure than CPU utilization. But they predict outcomes that CPU utilization doesn't. A rising knowledge concentration index means you're creating single points of failure even if nothing has broken yet.
Why This Shift Matters
The old dashboard told you when something was broken. The new dashboard tells you when something is about to break — because the organizational conditions for failure are present. Most engineering leaders don't track these because they don't know how. The data is harder to collect. But the teams that figure it out will have a fundamental advantage.
They'll see the failure coming before it arrives. They'll invest in the right preventative work instead of always fighting fires.
What You Gain by Tracking These
Teams that track organizational health metrics in addition to operational ones consistently outperform their peers. They catch problems earlier. They invest in the right preventative work. They don't get surprised by turnover, because they saw the knowledge concentration index rising months in advance.
The metrics themselves aren't the point. The point is that you start seeing the organization as a system — with its own failure modes, bottlenecks, and leverage points. That's a fundamentally different perspective from monitoring CPU and response times.
The Challenge of Getting Started
None of these metrics are easy to collect. Most require custom instrumentation, organizational buy-in, and a willingness to measure things that haven't been measured before. Start with one — knowledge concentration is usually the most revealing — and build from there.
A New Way to Think About Dashboards
The best engineering dashboard I've seen recently wasn't built by a monitoring vendor. It was built by a team that asked a simple question: "What would tell us, at a glance, whether our engineering organization is getting healthier?"
Their answer included things like how many decisions were made per week that didn't need escalation, how many architecture violations were caught at review time versus in production, and how many people could independently explain each critical system's architecture.
None of these came from standard monitoring tools. They came from instrumenting the decision process itself — and that required thinking differently about what to measure.
That's the shift. The dashboard of the future doesn't just measure the system. It measures the organization's ability to keep the system healthy. That's the metric that actually matters.
Think this argument fits your event? Tell me about the room — the calendar is selective.
Start a conversation